About ntermen.nl
ntermen.nl collects the n-terms of the Dutch national school-leaving exams, from 2000 to 2026, together with the other figures that are published about each exam. This page explains what the n-term is, what you can find on the site, who makes it and where the data comes from. The rest of the site is in Dutch, but most pages are tables and charts that need few words.
The Dutch central exams
Secondary school in the Netherlands has three main levels. vmbo is pre-vocational education and takes four years; it has several tracks, which this site calls vmbo-bb, vmbo-kb and vmbo-gl/tl. havo is senior general secondary education and takes five years. vwo is pre-university education and takes six years.
At the end of each level, students take a central exam (centraal examen) in every subject they finish. These exams are the same for every school in the country and are taken on the same day, in May. The College voor Toetsen en Examens (CvTE) is responsible for them; Cito, the national institute for educational measurement, builds them and analyses the results.
The central exam counts for half of the final grade in a subject. The other half is the school exam (schoolexamen), which the school sets and marks itself. Dutch grades run from 1.0 to 10.0, and 5.5 is a pass.
Besides the general rules on how many fails are allowed, two rules involve the central exam directly. The average of all central exam grades, unrounded, must be at least 5.5 (since 2011). And at havo and vwo, a student may have at most one 5 as final grade for Dutch, English and mathematics together; at vmbo, the final grade for Dutch must be at least 5. Source: Examenblad, Exameneisen.
What is the n-term?
After a central exam, the teacher marks the work with the official marking scheme, and a second examiner from another school checks it. That gives each student a score: a number of points. The score is then turned into a grade with one formula:
grade = 9 × score / maximum score + n-term
The n-term (normeringsterm) is a number that the CvTE sets for every exam, every year, after the exam has been taken. Every subject at every level gets its own n-term: vmbo, havo and vwo, and also the resit exams in June, which have their own n-term. Usually it lies between 0.0 and 2.0; in a few exams it has been higher.
The n-term exists because no two exams are equally difficult. If an exam turns out harder than usual, students score fewer points for the same knowledge, and a higher n-term makes up for that. If the exam was easier, the n-term goes down. The aim is that a grade means the same thing from year to year. To decide, Cito analyses how the students did and compares the exam with those of earlier years; the CvTE then sets the n-term.
An example: on an exam with 75 points, a student scores 45. With an n-term of 1.0 that is 9 × 45 / 75 + 1.0 = 6.4. With an n-term of 1.5 the same score gives a 6.9. With an n-term of 1.0, a student needs half of the points for a pass.
At the very bottom and the very top of the scale, a few extra rules apply when the n-term is not 1.0. They make sure that very low and very high scores are not pushed up or down too far. For most students the formula above is all there is.
The n-term is announced in June, a few weeks after the exams. Teachers wait for it: until then they know their students' scores, but not their grades. Since a tenth more or less can turn a fail into a pass for many students, the n-term is followed closely every year.
Official information (in Dutch)
- Examenblad ↗The official pages about the n-term, with infographics and a video.
- Explainer video ↗The Examenblad video about how exams are scored.
- Toetswijzer ↗A more detailed account of how the n-term is set.
- Wikipedia ↗A short description of the n-term with a little data.
- Mathematics ↗A mathematical explanation of the n-term and the grades, by a maths teacher.
What you can find on this site
Look up n-terms. See every year of one subject (Per vak), all subjects of one year next to their usual n-term (Per jaar), all subjects and years in one grid, subjects and levels side by side, or make your own table to download.
Calculate. The n-voorspeller gives an estimate of the n-term based on the p-value (the share of points students scored on average). The conversion table shows which grade belongs to which score. On Andere n-term you can move the n-term of an exam and see what happens to the average grade and the number of fails. With Jouw examenrapport, anyone who took the exams can enter their grades and see where they stood among all students that year. Around the exams, teachers can guess the n-term of their own subject.
Insights. How precise is an exam (Meetfout)? For which subjects does the n-term follow the p-value (Voorspelbaarheid)? Which exams were the record holders, and how many students take each subject?
Score distributions. Since 2008, we know for most exams how many students scored each number of points. That distribution is shown for every subject.
A similar site in England
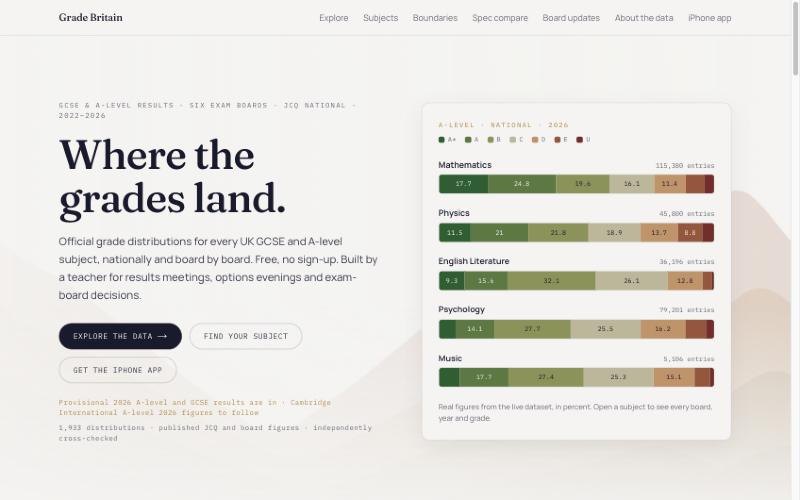
Website from England
Grade Britain
A teacher in England collects the results of the GCSE and A-level exams there: per subject, per exam board and per year, from 2022.
England has no n-term. After marking, each exam board sets grade boundaries for every grade of every exam.
Similar sites in Ireland, Hong Kong, Finland and Poland (page in Dutch) →
Who
From 1995 to 2023 I was a physics teacher. In those years I taught more than a thousand students in their exam year, from vmbo-t (the theoretical track of vmbo) up to vwo. Today I work as programme leader of the expertise schools (expertisescholen) at Ontwikkelkracht.
I have to admit that I started this site out of some irritation. The uncertainty about the final grades once you have marked the exams, the always somewhat vague stories from the CvTE, the justified complaints of colleagues across the country. And if you simply wanted to see what the n-terms had been in recent years, you had to dig very, very deep. That could be done differently. And so it can.
I have also enjoyed building it. I am a maker and I like learning new things, and designing and building a site like this brings the two together. Makers will know how good it feels when something finally works. Building a website with two programming languages (PHP and JavaScript), HTML and CSS takes you through deep valleys and to high peaks, and that is great. Since 2026 I have done this together with an AI assistant, and the site now reads its data directly from an Excel file.
Finally, I believe strongly in sharing and in doing things together. I hope this site helps someone, and that it makes their work a little lighter, more enjoyable or clearer.
Want to know more about me? Have a look at my LinkedIn page or send me a message (the form is in Dutch, but you can write in English).
Arjan van der Meij

Statistics
- 1,963n-terms in 27 years
- 26,666,154exams taken
- 927,739,085questions marked
- 59.4%correct on average
- 1.04average n-term
- 6.3average grade
- 22.6%fails on average
Weakest result
Best result
P-value and n-term of all exams
Each dot is one exam. Hover over a dot (or tap it) for the subject and the year. Click a level in the legend to show or hide it.
The data
The data comes from Cito, which has published exam reports since 2000. From 2005 there is an Excel application with the figures. All of it is now in one Excel file, which the site reads directly. You can download it yourself on the Open data page.
The data from 2000 to 2004 was harder to collect, because it was in tables in PDF reports. I removed the unnecessary information, converted the files to Excel with an online tool, and edited the sheets (without changing the data) so that they could go into the database.
Some notes on the data:
- There is no data for 2020. That year there were no central exams because of the covid-19 pandemic.
- The data for vmbo-bb and vmbo-kb runs until 2023. Those exams are taken digitally and have not been in Cito's overviews since then.
- For wiskunde A and C (mathematics A and C), Cito's item analysis has listed a maximum score that is too high since 2024. I corrected it using the score distributions and recalculated the p-value.
- The score distributions come from Cito's sample, not from all students. Until 2023 they come from the file “betekenis van cijfers”, after that from the distribution per exam.
- The n-terms of the practical vocational subjects of vmbo are not included. At first I made the database only for myself and looked only at havo and vwo. When someone asked, I added the general subjects of vmbo. Nobody has asked for the vocational subjects yet.
- Subjects for which no p-value can be determined are left out. They say nothing about long-term trends and are not predictive, for example small subjects such as Frisian and Arabic.
- Subjects that existed only briefly since 2000 are left out too. Where a subject changed its name, the site links the old and new names; see Vaknamen.
- When a subject gets a new programme, there is usually a pilot year with few students before it, and a broom exam (bezemvak) after it for students who failed the old one. Those small groups are left out as well.
- In 2000, 2001 and 2002, mavo students could still take exams at level C or D (D was the highest). After 2002 mavo became part of vmbo and level C disappeared. Level C is not included; level D is, under vmbo-gl/tl, for some continuity. The reports only give the total number of students, so I assumed that the split between C and D was the same as in the samples. Do not use these years for precise measurements.
ntermen.nl is an independent project and is not affiliated with the College voor Toetsen en Examens (CvTE), Cito or the Dutch Ministry of Education. All tables, charts and calculations are based on the official data published by the CvTE and Cito.